
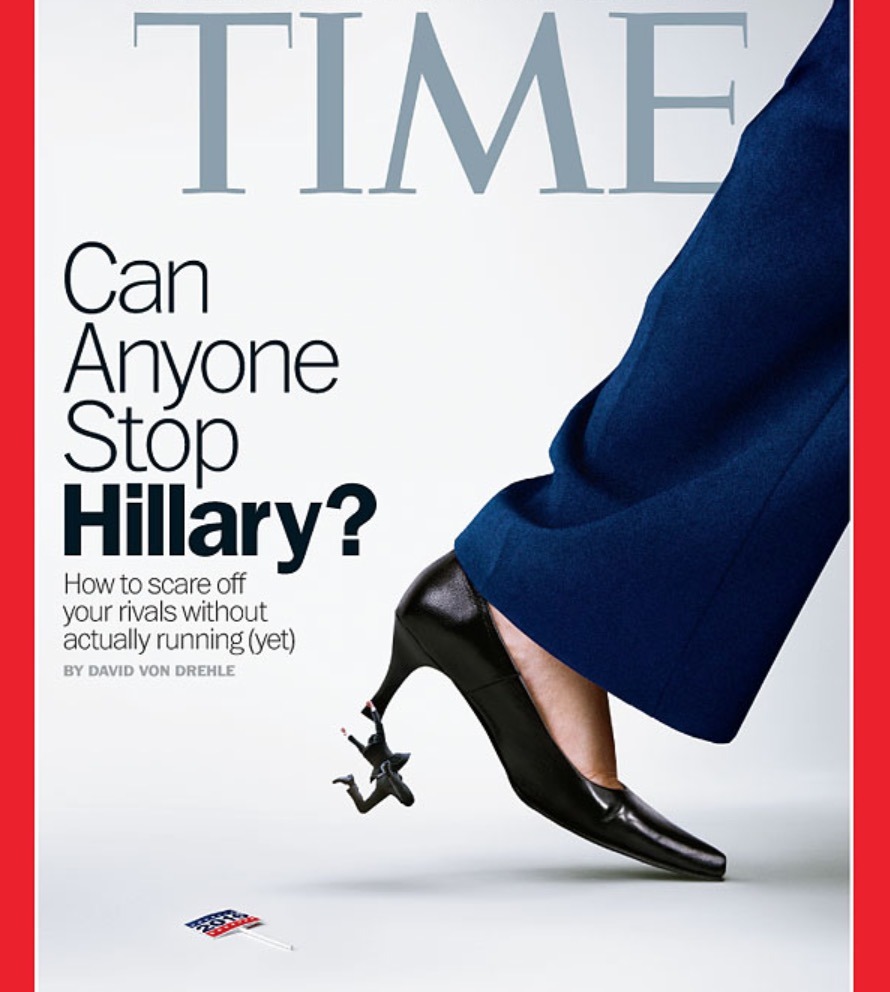
*2014 Time Magazine Cover
Years ago, when I was an exchange student in the Soviet Union, a Russian friend explained how he got his news.
“For news about Russia, Radio Liberty,” he said. “For news about America, Soviet newspapers.” He smiled. “Countries lie about themselves, tell truth about others.”
American media consumers are fast approaching the same absurd binary reality. We now have one set of news outlets that gives us the bad news about Democrats, and another set of news outlets bravely dedicated to reporting the whole truth about Republicans.
Like the old adage about quarterbacks – if you think you have two good ones, you probably have none.
– From Matt Taibbi’s excellent article: The Summer of the Shill
A couple of days ago, investigative journalist Sharyl Attkisson published a very interesting article which examined how Bloomberg News egregiously spun the results of its recent presidential poll.
She notes:
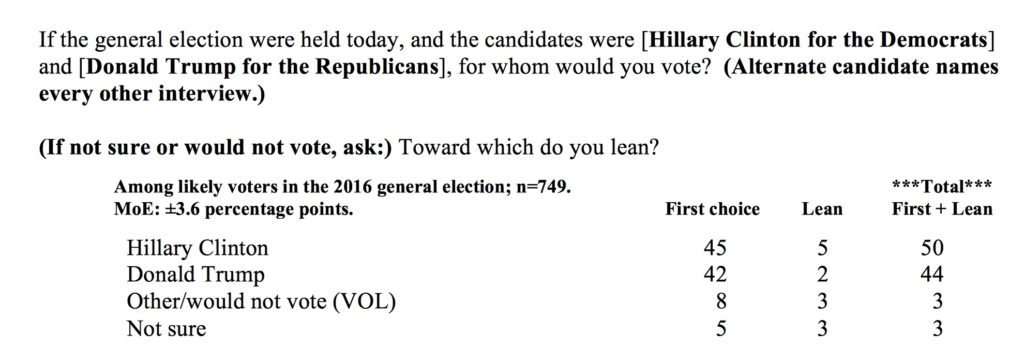
Is Hillary Clinton squashing Donald Trump into oblivion in the polls? Or is her lead over him perilously shrinking? One thing we know is: there are countless ways to spin a poll. Consider the case of selective reporting on the most recent Bloomberg national poll.
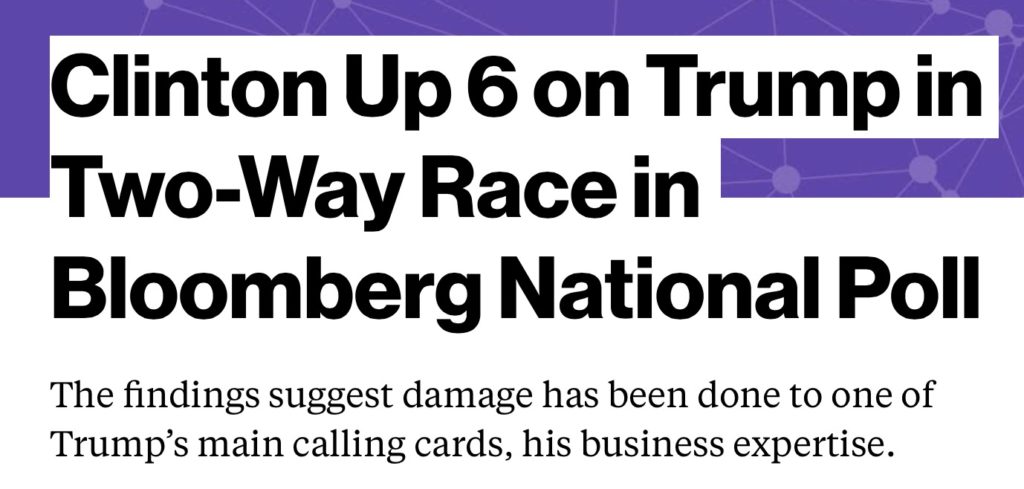
On Aug. 10, Bloomberg reported “Clinton up 6 on Trump in Two Way Race.” But looking at the actual poll, Trump has moved so close to Clinton, the results are within the margin of error.
In the most recent poll, the spread between Clinton and Trump in a two-person race was down to just 3 percentage points, Clinton at 45% and Trump at 42%. That’s within the margin of error. When Libertarian and Green Party candidates are put in the mix, it’s Clinton 42% and Trump 40% –again within the margin of error.
But this notable trend isn’t reflected in the Bloomberg write-up here. Instead, the reporter chose to use the poll numbers that look better for Clinton: ones that added in “leaners.” What are leaners? Respondents who were first asked who they’d vote for, then answered they didn’t plan to vote or didn’t know who they’d vote for, and then were pressed to pick a candidate they were leaning toward, anyway. This is how Bloomberg got to the 6-point spread cited in its headline…double the actual spread of 3%.
The graphic Bloomberg used in its news story appears somewhat misleading in this context. It depicts the 6-point spread as the result of the question “…for whom would you vote?” It doesn’t disclose that the graphic adds in “leaners” who were asked a followup question.
It’s simply another reminder that what you read in the news often comes through a filter.
So here’s the primary thing Sharyl is calling out in the above paragraphs.
From Bloomberg’s polling data:
While I’ll give Bloomberg the benefit of the doubt and assume that they’ve always included the “lean” category in their totals (they did for June, unclear if they did prior to that), is adding this category to the total really justified? Moreover, Bloomberg should make this meaningful choice clear in the text of their article (they don’t), particularly when the tone of the article is unabashedly promoting the idea that Clinton is doing incredibly well.
All you need to do is take a look at the article’s heading to see how biased it is.
Does this seem in any way appropriate considering her lead when not including the “lean” category is a measly 3 points? Moreover, what does Bloomberg’s own polling data tell us about the race when Gary Johnson and Jill Stein are included (as they should be since they will appear on most ballots).
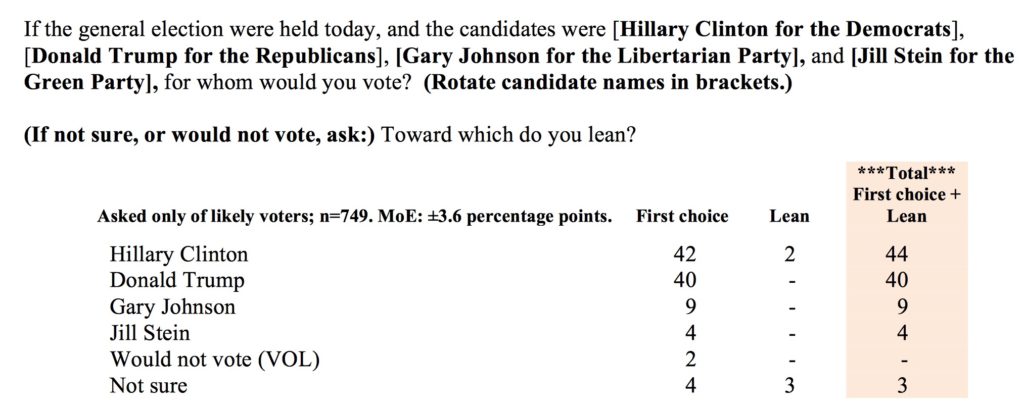
So with the four options that appear on most ballots, Clinton is in a pretty tight race with Trump. These are the facts, but as you saw, the article’s headline was incredibly misleading and skewed to make it seem as if a Hillary victory is inevitable.
But it’s not just the headline. The entire article reads like PR for team Hillary. A few more paragraphs of note:
Hillary Clinton has retained most of the bounce she received after the Democratic National Convention and now enjoys a 6-point lead over Donald Trump in a two-way contest among likely voters.
The findings suggest damage has been done to one of Trump’s main calling cards, his business expertise, with 61 percent of likely voters saying they’re less impressed with the Republican nominee’s business acumen than when the campaign started.
Clinton’s lead over Trump of 50 percent to 44 percent in a two-way contest is boosted by a greater consolidation of support among Democrats than Republicans have shown for their candidate. She wins 94 percent of the Democratic vote, including 93 percent of Democrats who backed Senator Bernie Sanders in the primary race, while Trump gets 87 percent of the Republican vote.
Does the above sound like fair coverage of a poll that shows a 2 point spread between Clinton and Trump in a four person race? While Bloomberg does acknowledge that the results are within the margin of error in a four person race, it is mentioned as an aside as opposed to being the focal point of the piece. Instead, the writer chooses to focus his attention on how strong Hillary’s position is relative to Trump. A fact that doesn’t seem to be confirmed by the actual poll results.
Here’s some more “analysis” from the article.
The poll confirms Clinton emerged from the noisy campaign week that followed her convention in a stronger position than Trump. That edge could prove valuable, if she can maintain it, during a period when there are no major events on the political calendar until the first debate on Sept. 26.
“The question following a convention bounce is how much of it will stick, as memory of the event and excitement fades,” said pollster J. Ann Selzer, whose Iowa-based firm Selzer & Co. oversaw the survey. “For Clinton, the contest is far from settled, but she is on solid ground.”
Clinton’s voters are more positive about her candidacy than those backing Trump are about his, with 56 percent saying their alignment with her is more an act of support than to stop Trump. His fans, meanwhile, are more motivated by their disdain for her, with 56 percent saying their backing of Trump is more a vote against her than support for him.
So what’s my point? My point is this race is a lot closer than people think, and media headlines re:polls are probably being spun across the board. Most people just read headlines and never bother to actually read articles, let alone dig into the underlying poll data to see what’s really going on. As such, people are being manipulated by the media into thinking that Clinton is inevitable when she isn’t.
This explains a lot. I’ve been shocked by the visceral hatred being spewed by pro-Clinton henchmen at Jill Stein and her followers over the past few weeks. Such attacks make no sense unless Clinton people:
1) Know the election is much closer than the media is claiming.
2) Recognize Sanders supporters are not backing her to the extent media implies.
Which brings me to the final point. In its article, Bloomberg claims 93% of Democrats who backed Sanders support Hillary. This is a clever slight of hand because many Sanders supporters are not registered Democrats. A casual reader will come away thinking that 93% of Sanders supporters back Hillary, which is unquestionably untrue. Telling readers what percentage of Democratic Sanders supporters back Clinton tells you absolutely nothing. I’ve said for months that anywhere between 25%-33% of Sanders supporters will either vote Jill Stein or stay home. I stick to that prediction.
While we’re at it, I just launched a Twitter poll. Here are the very unscientific results so far (don’t forget to vote).
This poll is for Bernie Sanders supporters only.
Will you be voting for Hillary Clinton?— Michael Krieger (@LibertyBlitz) August 16, 2016
For related articles, see:
How California’s Primary was Rigged Against Independent Voters
As Expected, New York’s Primary is Already a Pathetic Mess
Hillary Clinton Will Win New York, Because New York is Running a Banana Republic Primary
American Democracy – Allegations of Voter Suppression Emerge from the Arizona Primary
This is how elections are really rigged. Far before people ever get to the voting booths.
In Liberty,
Michael Krieger

Donate bitcoins: 35DBUbbAQHTqbDaAc5mAaN6BqwA2AxuE7G
Follow me on Twitter.

33% of Sanders supporters won’t vote Hillary? Are you saying 67% will?
Nobody knows anything at this point, but I don’t see 8 million people rushing to vote on election day for someone who treated them so badly.
All these numbers showing “the election is over” can backfire – well, if Hillary has already won, I have better things to do on a Tuesday – she doesn’t need my vote. Look at Brexit.
True, I’m probably being conservative on that estimate.
I’m very surprised that Time covered this. Are they trying to rebuild their credibility?
What did Time cover?
Hey!
I have seen all these fun and games 2 years ago during the Indian elections. No poll predicted the final outcome, except one (who got to call themselves ethical- then failed to predict a crucial state election). After the election, there will be a lot of soul searching by the pollsters. Maybe Nate Silver will do a post explaining why they failed.
The explanation with the Indian pollsters was that the sampling is not random. They do convenience sampling, and then use previous years data to convert that sample into actual poll results. There excuse was that the 2014 election was so different from the previous years that the statistical conversion factors did not reflect reality.
Sorry about the anonymity, but frankly, the US elections are terrifying me.